
How natural gas prices effect the oil prices
.jpg)
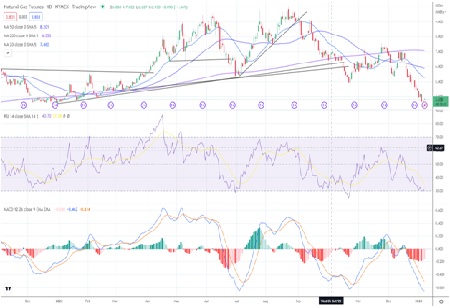
Natural gas prices experienced a wild ride in 2022. Prices reached an annual high above $10 per MMBtu in August and fell to 4.47 at the end of December 2022 (see chart). The rise was due to concern over the lack of natural gas available in Europe and the draw that would occur on U.S. natural gas stockpiles to create LNG to be shipped across the pond. As the weather in Europe and the United States moderated in Q4 2022, prices started to move lower and finished the year nearly flat.
Natural gas is used in several industries. According to the Energy Information Administration, natural gas makes up about 30% of energy consumption in the United States. About 37% of the consumption is for electrical power. Electrical generators use natural gas to run turbines and create electricity. About 33% of the natural gas used in the United States is for industrial manufacturing. Approximately 15% is used for residential heating, while 11% is for commercial heating. Finally, about 4% of the natural gas used in the United States is for transportation.
One of the best ways to determine if natural gas prices affect the movements of oil prices or vice versa is to determine if natural gas and crude oil prices are correlated.
What is Correlation?
Correlation is a statistical term that determines if the returns of two assets move in tandem. When the returns of two investments move in lockstep, the two assets correlate 100% or 1. If the returns of the two investments move in opposite directions, the two assets correlate at -100% or -1. When there is no traceable observable movement, the correlation is zero. Correlation is not a measure of cause and effect. The statistical metrics are merely an indicator of the similarities between the returns of two assets.
Natural gas prices and WTI crude oil prices correlate by 25%. This statistic means that 25% of the change in natural gas prices can account for the differences in WTI crude oil prices. It also means that 25% of the movement in WTI crude oil is generated from the natural gas price returns.
Looking at the history of the two-time series, from 2003 to 2008, there was a positive correlation between natural gas and crude oil. There seems to be very little correlation between natural gas and oil between 2009 and 2020
Why Has the Correlation between Natural Gas and Crude Oil Broken Down?
Natural gas is found in formations and near oil wells and coal beds. While fracking has been around since 1947, extracting natural gas started to accelerate in the 21st century. Fracking uses water and silica sand to blast natural gas beds and extract natural gas from the ground. The process generates waste that needs to be disposed of, and this issue has created a bad rap for the fracking process.
Horizontal drilling is another process that allows natural gas producers to dig sideways and attract natural gas and oil from the ground.
Fracking and horizontal drilling have become popular over the past few decades and do not need to be near oil wells. The only significant overlapped between oil and natural gas in terms of the user base is residential and commercial heating. Oil is generally not used for electricity generation, while natural gas is not a significant energy used in transportation.
The returns of oil and natural gas were likely correlated when most of the natural gas was attracted near oil wells, but the move to natural gas beds has likely removed most of the correlation.
Why Do Natural Gas Prices Fluctuate?
Natural gas prices fluctuate due to changes in supply and demand. Since there are few alternatives to natural gas for electrical generation and heating, the asset cannot be replaced with other options. Most natural gas is domestically produced as liquifying it and transporting it to another location is costly. Natural gas is generally piped from one location to another location. For example, Russia is a large exporter of natural gas. Before the war with Ukraine, Russia was the largest natural gas supplier to Western Europe via pipeline.
Since the main drivers of natural gas consumption is electrical and heat, the weather will play a large role in generating demand. During the winter, the northern areas might use natural gas to fire boilers. In the milder regions, natural gas is also used to generate electricity for heating. During warmer periods, natural gas consumption will rise due to cooling demand via air conditioning.
The supply of natural gas will vary based on price and consumption. The weather can also impact it. Storms will knock out production in the Gulf of Mexico. Not only can installations be affected, but the crews might be evacuated if a storm is expected to be very strong.
There are multiple ways that a trader can track weather changes. One of the most popular is through the National Oceanic Atmospheric Administration (NOAA). The organization provides information on the current market climate and significant storms. In the United States, the hurricane season is between July and October. The NOAA hurricane tracker is used throughout the industry. Traders will monitor this tracker during the hurricane season to determine if NOAA sees a tropical cyclone forming within the next 48 hours.
Climate prediction by NOAA is another popular forecast. NOAA will provide traders with a 6-10 and an 8-14 day forecast which shows forecasts that are either normal, warmer than normal, or cooler than normal. During the winter, colder-than-normal temperatures will generally drive the price of natural gas. Warmer-than-normal forecasts will usually drive prices lower during the winter.
The climate prediction center will also provide information on precipitation, which can be used to determine if there will be significant snowfall, which would keep an area colder than average.
Why Do Crude Oil prices Fluctuate?
Crude oil prices move along with changes in supply and demand, similar to natural gas. The largest demand impacts are economic strength and prices. Consumers purchase a lot of gasoline when prices are low, and when prices are high, they pair back. As for heating demand, demand is a function of cold weather.
One way to gauge U.S. demand is to look at the Energy Information Administration summary of weekly petroleum data. In this weekly report, the EIA provides product supplied, which is an estimate of demand. Approximately 21 million barrels of oil products are consumed daily in the United States. Most of the demand is gasoline, followed by distillate fuels, which include heating oil, diesel fuel, and jet fuel. The summary also shows you the oil volumes stored in inventory. As inventory rises, the U.S.'s cushion has increased, and shocks become less sensitive to supply-side effects.
The supply side of oil is international. There are issues with nations that produce oil. Many are state-owned. For example, Saudi Arabia, Russia, Mexico, and Venezuela are countries where oil production comes from the country, not private companies. If there are issues such as the war with Russia and Ukraine, the volumes of oil that can be produced will be diminished. There is also an oil cartel called OPEC. These oil-producing countries work as a group to increase or limit supply to control revenues that member countries need.
Oil prices are also driven by inclement weather. There can be supply disruptions due to hurricanes that hit large oil-producing regions. If you plan to engage in crude oil investing, you want to have a good understanding of the reasons that the price fluctuates.
The Bottom Line
The correlation between oil and natural gas used to be significant, but fundamental factors have eroded similar changes in each asset's returns. In the United States, natural gas and oil consumption are equally balanced, allowing the assets to move based on supply and demand. This phenomenon is not the same outside the United States, as most of the world is still primarily reliant on oil.
Oil and gas move because of supply and demand. Some of the reasons are similar such as the weather.
The war between Russia and Ukraine is likely to continue to bifurcate the localized differences in returns. In the United States, the correlation will likely remain low, while the rest of the world will likely see elevated levels of correlation between natural gas and oil.